AI -Powered Trade Analysis Software
Invest in Your Future — Build Trading Skills Through our AI-powered Trading Analytical Software


Just for Rs 24,999/- for a year *
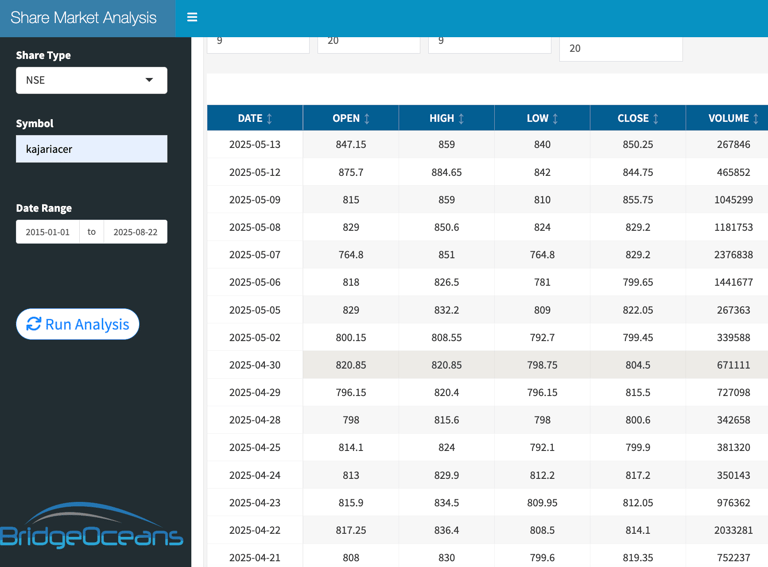
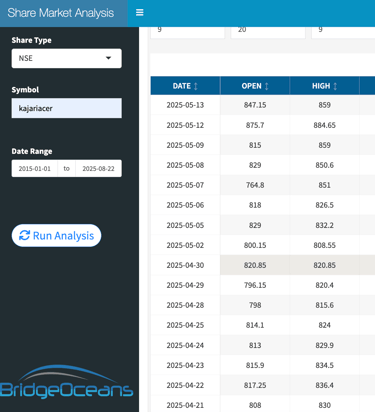
Real-time Historical data processing .
Adaptive AI Algorithm for accurate plotting graphs
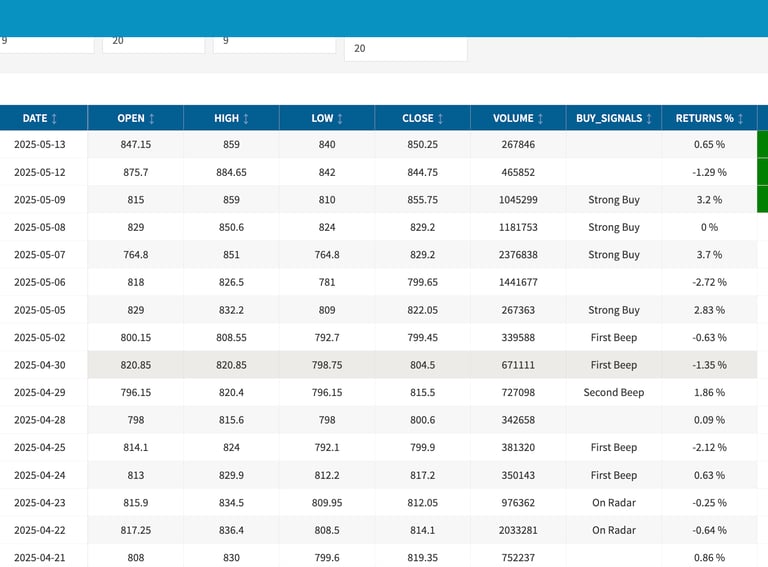
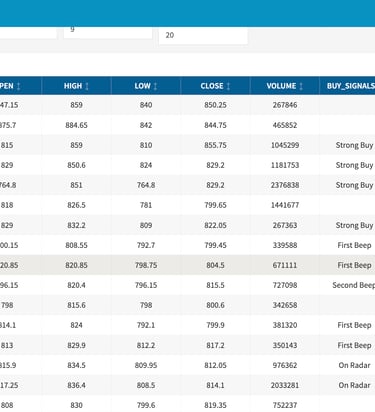
Alert Generation
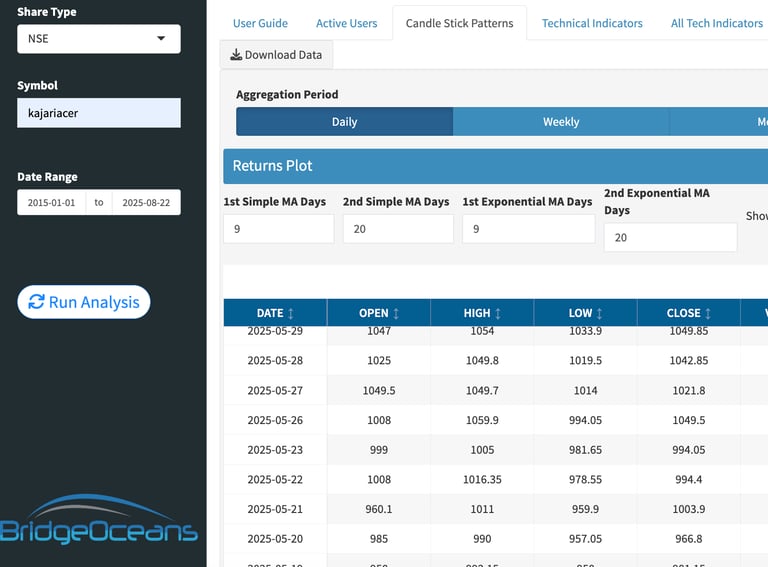
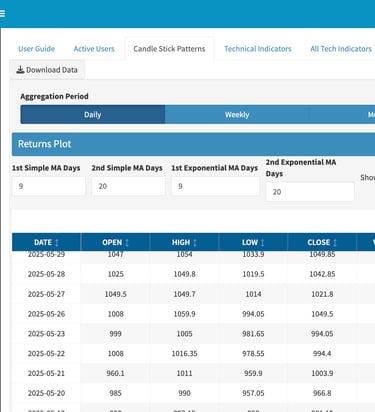
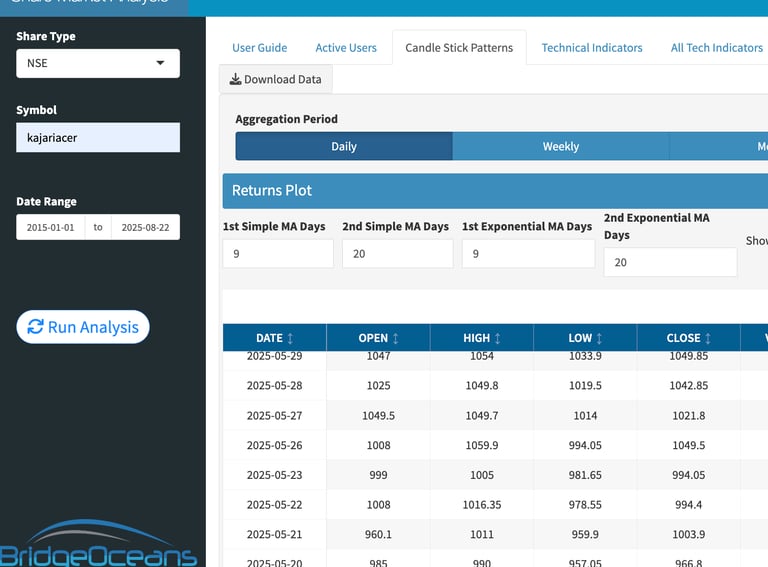
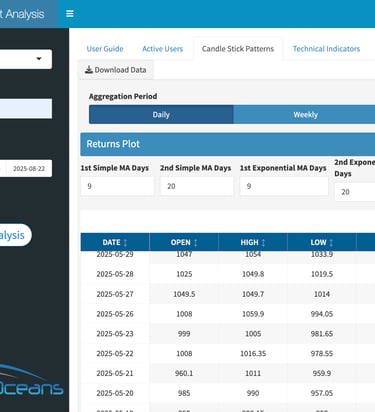
Live Market Trade Analysis
Processing multi-dimensional data
Real-time data analytics, customizable charts
AI Algorithm Involves evaluating market data which will help to learn how to optimizing trading decisions.
Key Feature of Software
1. AI-Powered Real-Time Market Analysis
What It Does: Our advanced AI algorithms analyze vast amounts of market data in real-time, including price movements, trading volumes, and alternative data sources like news and sentiment.
Why It Matters: Stay ahead of the market with instant insights that would take hours to uncover manually, enabling faster and more informed trading decisions.
3. Customizable Strategy Builder and Backtesting
What It Does: Create and test trading strategies using a no-code, point-and-click interface. Backtest strategies against up to 52 week of historical data to evaluate performance metrics like win rate, profitability, and drawdown.
Why It Matters: Develop and refine strategies tailored to your trading style without needing programming expertise, ensuring confidence in your approach before going live.
Example: Build a strategy based on specific indicators (e.g., RSI, MACD) and test its performance across different market conditions.
2. Automated Charting and Pattern Recognition
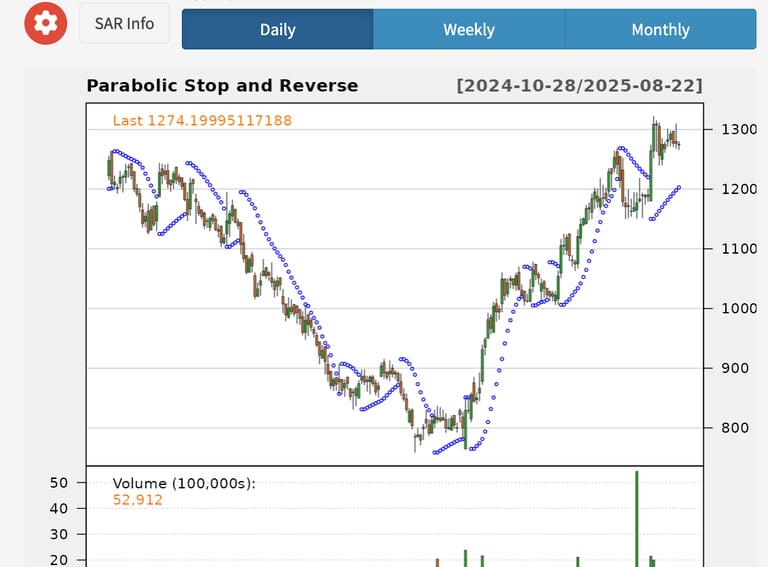
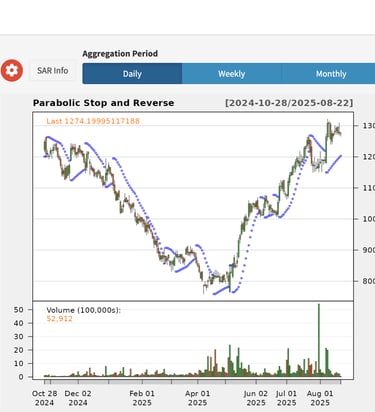
What It Does: The software automatically identifies and draws trendlines, support/resistance levels, and over 150 candlestick and chart patterns (e.g., triangles, flags, wedges) across multiple timeframes.
Why It Matters: Saves time and reduces human error by providing precise technical analysis, allowing you to focus on strategy rather than manual charting.
Example: Overlay weekly and daily trendlines on a single chart to reveal hidden market patterns.
4. Analytics
What It Does: Leverage machine learning technic to learn market trends and price movements based on historical data, technical indicators, and macroeconomic factors.
Why It Matters: Anticipate market shifts with data-driven patterns
5. User-Friendly Interface
What It Does: Offers an intuitive dashboard with customizable layouts, indicators, and alerts to suit your trading preferences and experience level.
Why It Matters: Simplifies complex analysis for beginners while providing advanced tools for seasoned traders, ensuring accessibility for all users.
Example: Personalized dashboard with preferred charts and metrics.
Services
Reach Us
Insurance
mayuresh@bowealth.com
+91 932 650 1127 | +91 983 409 7528
© 2025. All rights reserved.
Office : # 205 | Sundar Samruddhi Complex | Pari Company Road| Dhayari | Pune 411041